Sunday, 5 August 2018

How to Do a Competitive Marketing Analysis Using 6 Free Google Tools

We’ve seen and heard many people just throwing their business online, many times with great products, and failed at it. One of the reasons they failed was a lack of a well-structured marketing plan before they started the journey and as well as of competitive intelligence data. In today’s article, we wish to address that issue by presenting the tools made available by Google and going through some concepts and ideas that can be extracted with their use.

 

Competitive Marketing Analysis Using Free Google Tools


Let’s talk about the free tools from Google made available for you, tools that cost nothing and can offer you enough information to gain a sense of the market you’re about to jump into, besides a handful of actions and strategies you could perform to skyrocket your business. A true jam – packed with value!


  1. Arsenal of Tools
    1. Google AdWords Keyword Planner
    2. Google Trends
    3. Google Ad Preview and Diagnosis tool
    4. Google My Business
    5. Google +
    6. Google Analytics
  2. Your Market’s Behavior
    1. Customer Behavior Unlocking
    2. Where Are Your Customers Looking for Your Business
    3. What Development Stage Has Your Market Reached
  3. Uncovering Your Competitors’ Secrets
    1. Benchmark Every Metric to Your Competitor and Figure out Your Brand Power
    2. Always Compare Yourself to Your Competition
    3. Check Which Competitors Target Certain Keywords
  4. Identify New Market Opportunities
    1. Low Competition High Search Volume 
    2. Seek for Keywords Not yet Targeted
 

1. Arsenal of Tools


First things first, the weapons you have at your disposal. We’re sure you know that Google offers a wide variety of tools, all free of charge (we’ll repeat that today), that help you gather information about the market and, more importantly, competitors information. So we have the following: Google Keyword Planner, Google Trends, Ad Preview and Diagnosis tool, Google My Business, Google + and last but not least Google Analytics.

The Free Google Tools can be used to study your current competitors and also your site or generic niche.


All the tools mentioned above can be used to benchmark your own website, but you can also use them to keep track, measure and research any other site you desire. Google doesn’t limit their use in any shape or form, so why not use them to get ahead of your market?


1.1 Google AdWords Keyword Planner


The first weapon in the arsenal is the Google AdWords Keyword Planner. Now it’s not what it used to be. We miss you “Google keyword tool”! But it does bring a lot of value to the table, in terms of performing keyword research, finding the cost and so on. You can get some pretty good suggestions. Take a look at the screenshot below.
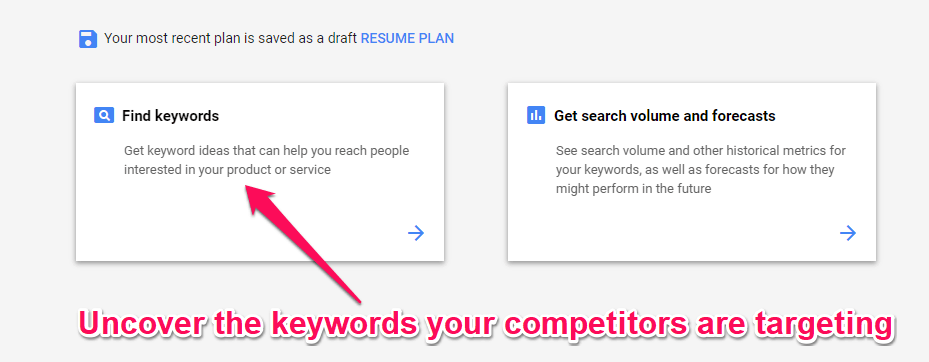
 

New Keyword Planner


The tool has a free format and a paid option. All users that have an active Adwords campaign will see more accurate data, and those who use the free option will see restricted info.


If you want some juicy competitive information, consumer search behavior, then you can use this free Google tool. It shows what people are searching for, how they are searching for it, and where they are searching for it: languages, dates, volumes of searches as well as the bidding competition that’s going on in Google Adwords.
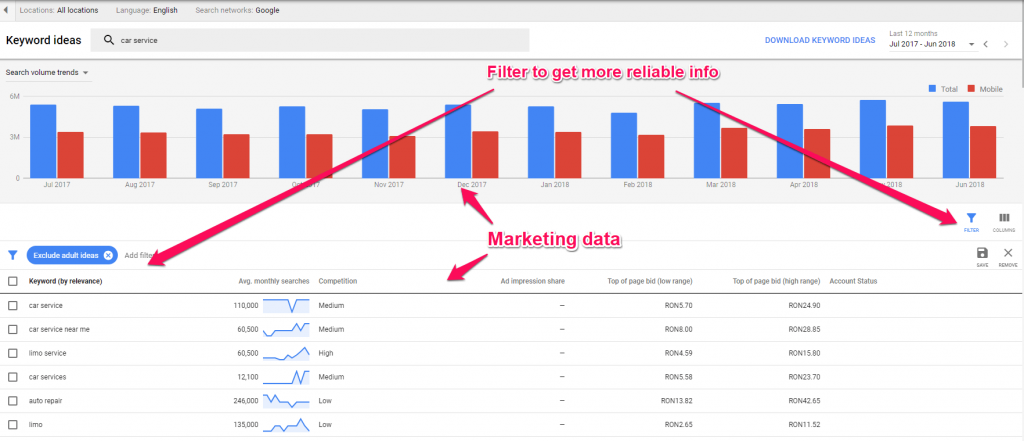
 

Keyword Planner marketing data


All of this by simply entering the keywords of the business you’re interested in. The next step, the pros practice, is to filter all that noise that comes with the tool, and we believe that’s what most people are complaining about this tool, the noise. What’s left after the advanced filtering action are the keywords that you want for your business. Especially the keywords with a high search volume, low competition with really low bidding war going on. We’ll get into that later on, let’s move on to the next weapon.


1.2 Google Trends


Another great tool for marketers to make competitive research is Google Trends. This one is by far our favorite tool when studying markets. It basically shows the search interest of people for certain keywords. What you should use it for is to study the market you want to tackle.
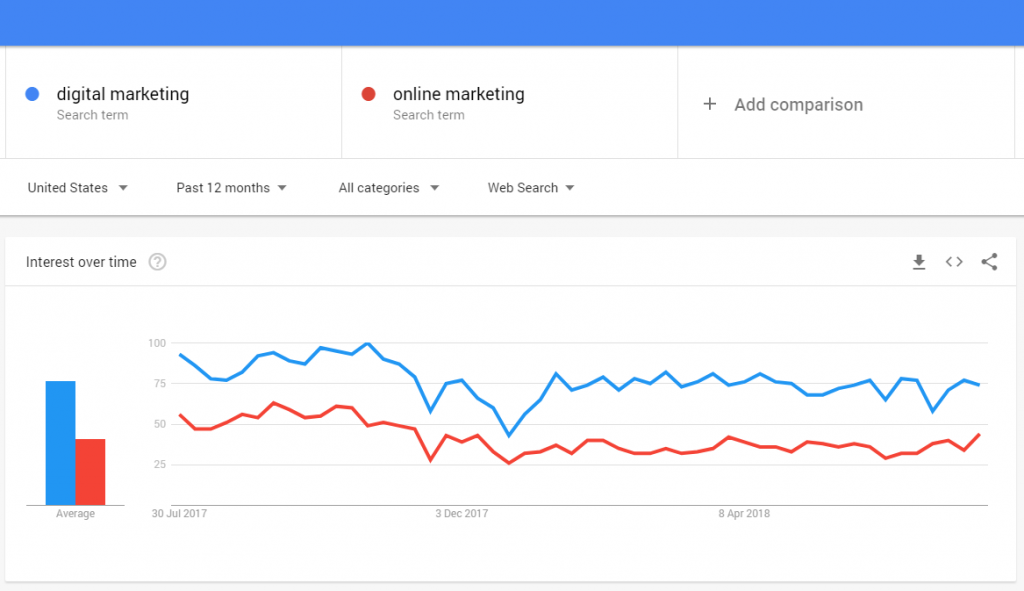
 

 Digital vs online marketing


And the search interest over time is not the only thing that Google Trends provides. It’s also a great way to study the market from different regions. In the example we’ve taken, we compared the search interest for digital vs. online marketing. Below you can see which countries search for the words “digital marketing” and which one search for “online marketing”. Now if you look at the screenshots below what can you notice?
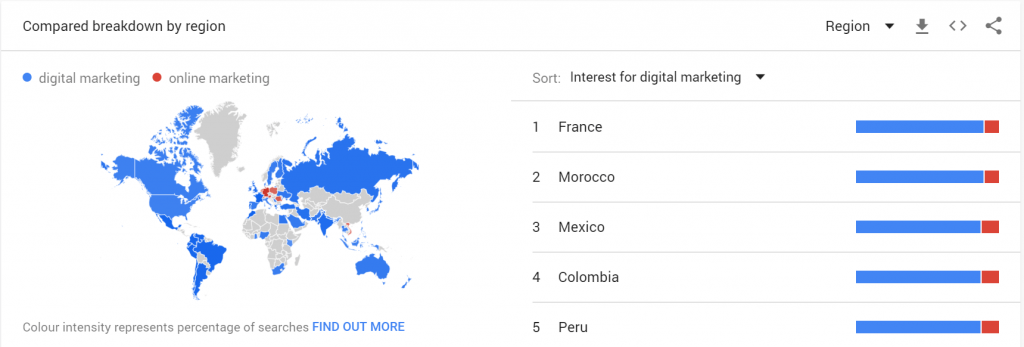
 

Regional interest Google trends


The “digital marketing” search phrase ranks really well in countries such as France and Morroco. The users have different search behaviors, that’s what we want to show with this. Mexico, Columbia and Peru look more colored in this screenshot than the one for “online marketing”. Canada and US are also more keen to use “digital marketing”. 


On the other side, the “online marketing” has more searches in Germany, Netherlands, Austria, Romania and Vietnam. 
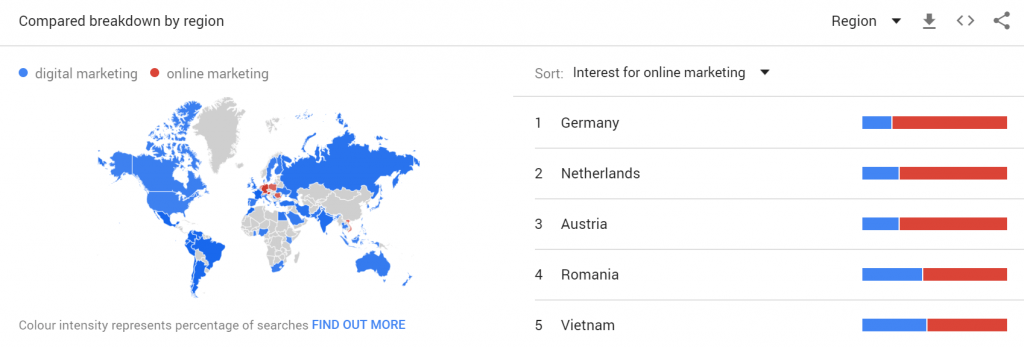
 

Regional interest Google trends for online marketing


This type of small researches can help you take some decisions before considering a digital marketing strategy to promote your business. 


Google Trends even offers some of the Google Keyword Planner tool functions by suggesting related keywords for the one you’ve just entered. You can use it to keep track of the keywords that are gaining ground rapidly (rising) and from those, you can notice some opportunities for your competitive strategy.
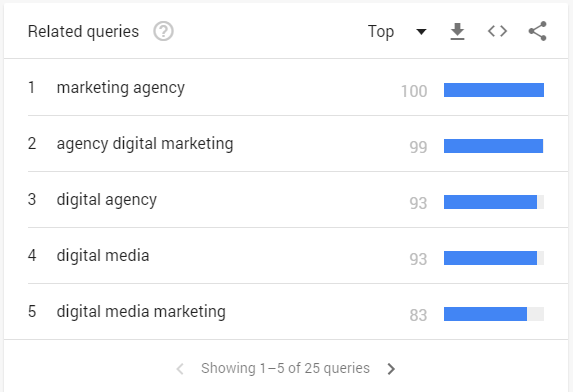
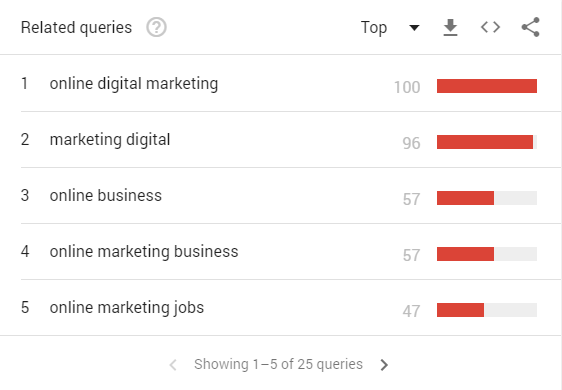
 

Related queries to digital marketingRelated queries to online marketing


You can even see the relates queries for sub-regions or a specific country, by clicking on the state you want. You even see the data for each city.
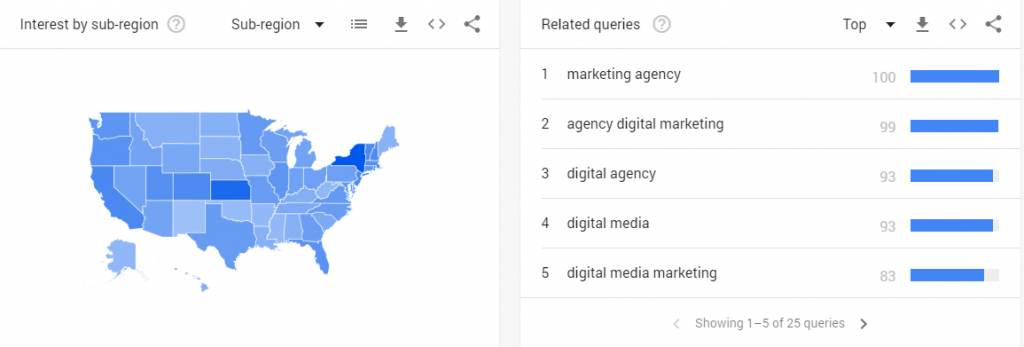
 

Interest by sub-region


1.3 Google Ad Preview and Diagnosis Tool


Ad Preview and Diagnosis tool is a great addition to enrich your competitor analysis. In theory, this tool provides you with the position of your competitor’s ad (along with yours, if that’s the case). You can see your top competitors and what keywords (or phrases) they are tracking, what they are promoting. You’ll get a closer step in understanding your competition. 
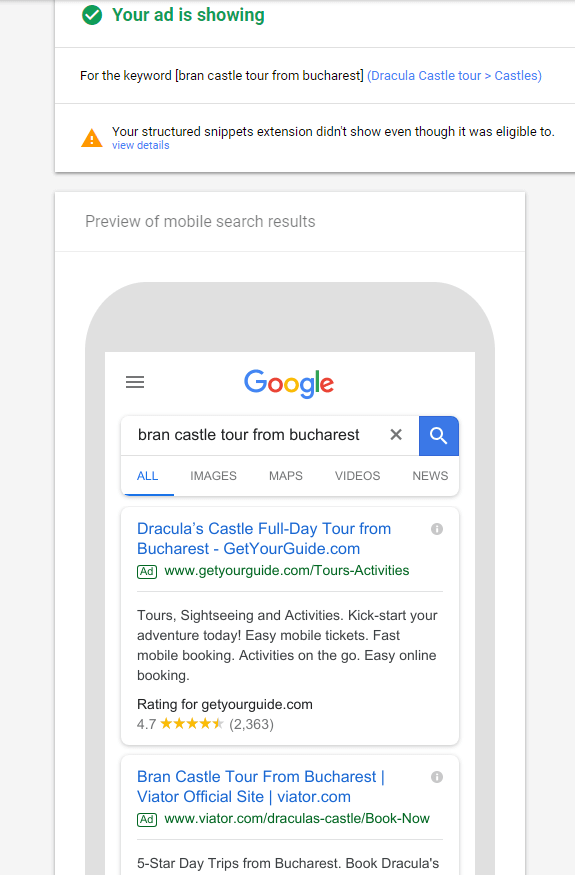
 

Ad Preview and Diagnosis Tool


1.4 Google My Business


Google My Business can really push your business on SERP if you setup your account correctly and let your customers know they can leave reviews. The tool is entirely free and it is easy to use.  When creating a page, it is recommended to see if the business isn’t already on Maps. If you found it, you have to claim it and edit the info, following the steps from the screenshot below.
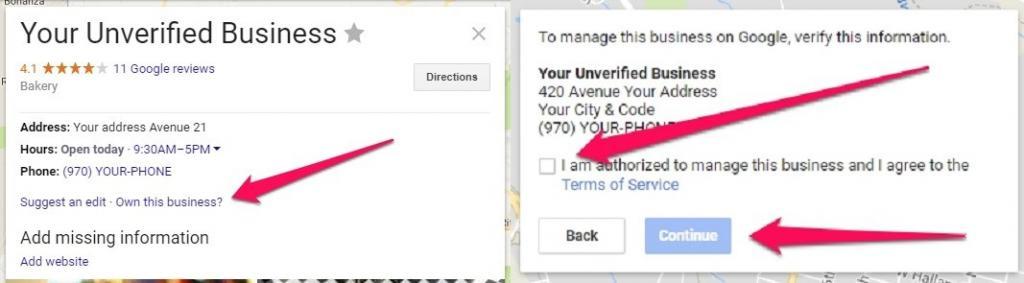
 

claim your local business


In case you don’t find it, you’ll have to create it. Add your business address, type of business, and website. After that, you’ll have to wait for a confirmation (a verification code in a postcard, most probably) which comes through mail, and that can take up to 14 days. Select businesses have the option to verify the business listing by phone or email.


To level up, add high-quality pictures regarding your office and business; add street-view, get reviews for your website, because they will help you rank higher in Map searches. Connect it with the Google + profile to get even more exposure. 


After you finished setting up your Google My Business page, you can edit and perform other changes or see performance metrics directly from the Dashboard:
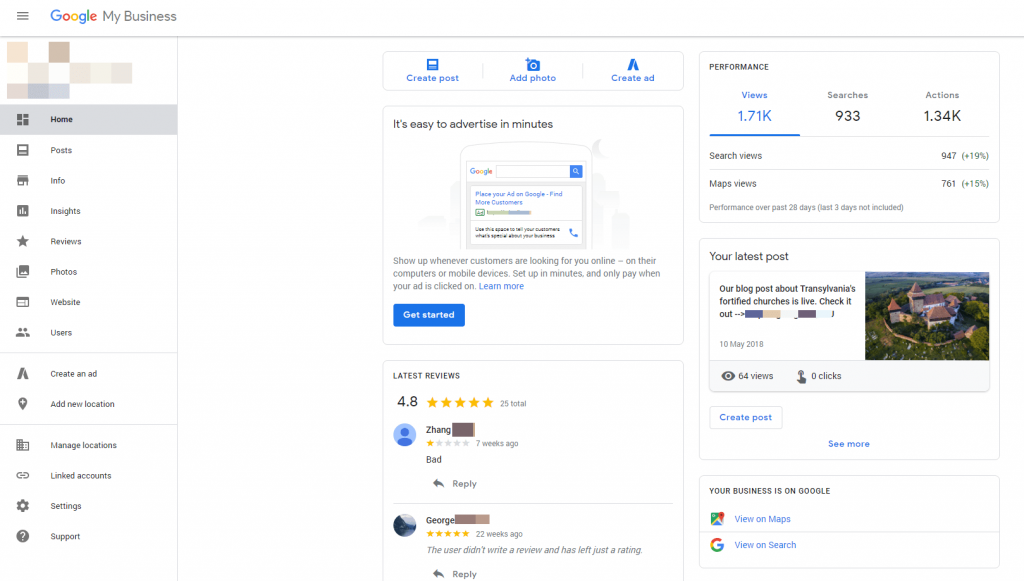
 

Google My Business Dashboard


1.5 Google +


Another tool in Google’s arsenal is Google +. I think social media was born to spy and follow what other people are doing without them knowing. It’s acting like the Invisibility Cloak. Google + is a powerful tool because it offers you the possibility to see what your competitor is sharing, if it has an active account, if it is has a verified account, the circles it’s in, the marketing campaigns it runs and many more. 


In the example below, you can see Lenovo’s Google + profile. It has a complete profile, integrated with other Google tool such as Hangouts, Google Calendar, Gmail plus links to its other social channels such as blog, Facebook, Instagram. 
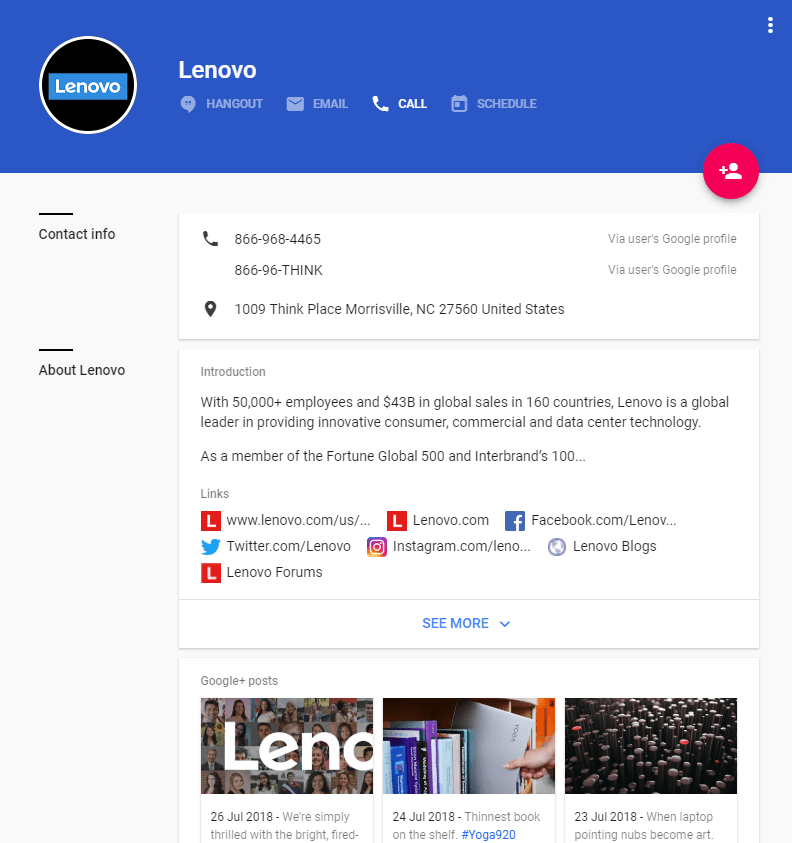
 

Google plus profile


At a quick scroll on their page, you’ll see posts mostly with inspirational messages and quotes, along with technology pictures mixing with pictures regarding the team and other Lenovo activities, and some Star Wars references. Doing a short analysis of their page help you see which type of content had more traction, get inspiration for your posts to attract the audience and get an overview of your competitor’s online presence.


We’ve witnessed a social signals impact that gets higher and higher as the time passes by. Social Media influences the evolution of a business. We made an in-house research where we analyzed the influence of social signals towards a website’s rankings. It showed that a strong presence on social networks is correlated with better rankings.


1.6. Google Analytics


To complete your market research use Google Analytics. There are some things from Google analytics that can give you an idea of your competition and your industry. The benchmarking option allows you to compare your data with aggregated industry data from other companies who share their data. That means you can get an idea of what happens with those that are in your niche – your competitors. You have to enable benchmarking first: 
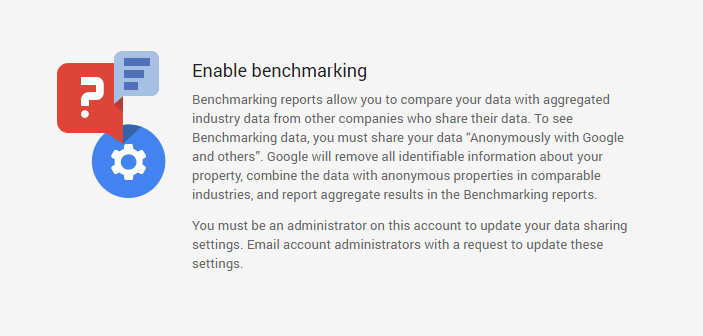
 

Enable benchmarking


After that, you’ll be able to see data related to devices, location and channels, which can give you a slight idea to see where you should focus more, where your competition is, where you have issues. More than that, you’ll have the opportunity to get some insights on your market segment.
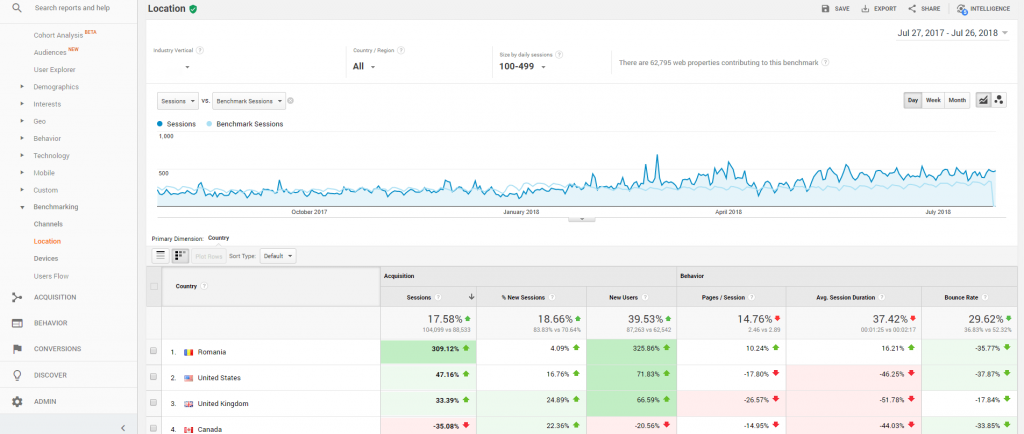
 

Benchmarking data


2. Your Market’s Behavior


Now that you’re familiar with the tools and what we are going to use them for, let’s take a real market example and see how we use it. We chose to take the music streaming market to explain an in-depth use of Google’s arsenal. The first thing when trying to enter a market is trying to learn the behavior of the consumers. When researching, we are going to focus on the following:

  • What do consumers search for?
  • What are the consumers’ expectations?
  • How are the competitors taking advantage of the consumers’ search behavior?
  • Which are the overall market trends?
  • What is the brand power of my competitors?
  • Can we find any hidden opportunities?
 

2.1  Customer Behavior Unlocking


The first tool we go to in our analysis of the music streaming market is the Google Keyword Planner. This tool will answer the first two questions (What are consumers searching for? & What are their expectations?) and maybe give us a hint for the last question (Hidden opportunities). To get to the answers, we inserted the landing pages of our future competitors in the keyword planner and began to read what it provides.


The competitors we considered for our analysis are Spotify, Pandora and Grooveshark. There are plenty more to study in order to make a complete analysis, but for the purpose of presenting how to do a competitive analysis information, we consider this to be sufficient to start with.


Search for your competitor’s website, add filters and removed the noise. All that is left are relevant keywords that the users search for to get to the pages.
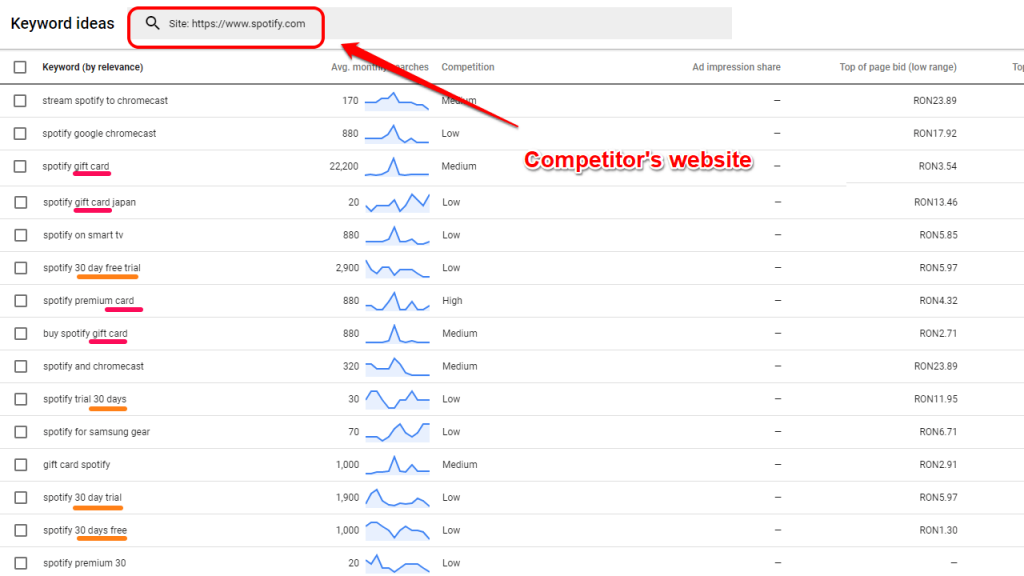
 

Keyword Planner for Spotify - card and trial


By entering the landing page for Spotify, Google Keywords Tools will show some keywords recommendations that might be related and could fit its description.

If we look at the keywords suggested by Google, an overwhelming amount contain the word “gift card” and “30 days trial”.

We can already start to figure out some expectations for the future users of our tool. Potential users don’t want to pay for it, they expect it to be free. Let’s study the other two competitors to see if this behavior fits all the users.
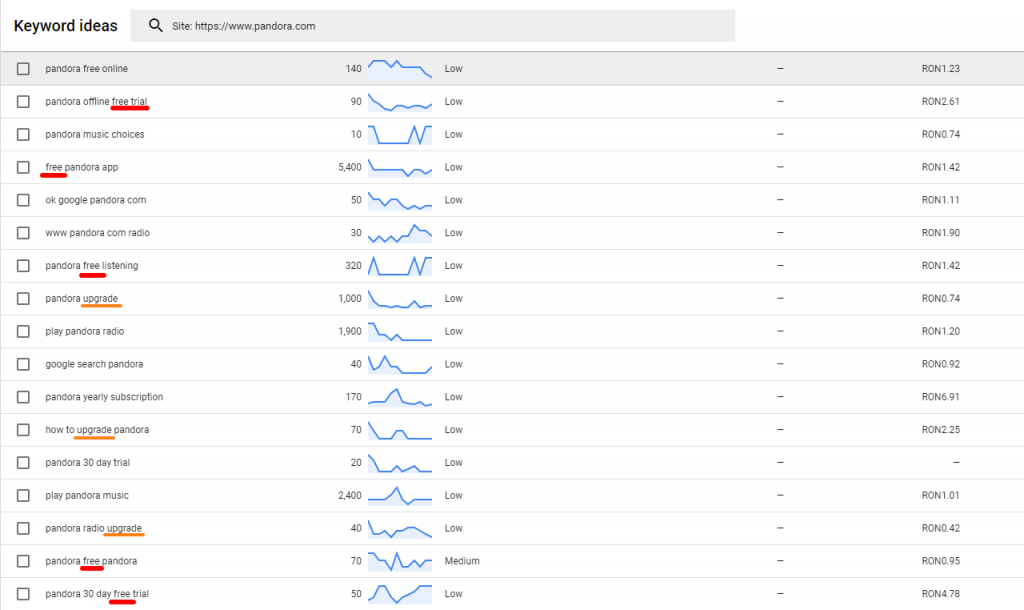
 

 Keyword Planner for Pandora - free and upgrade


For Pandora, the situation is almost the same. The difference here is that Google also suggests the word “upgrade” and “radio” more often. Their SEO efforts could have focused on promoting the service as an online radio in order to gather more website visitors from Google who search for this kind of service.

We can already start painting the persona for the user who searches for online music streaming.


Let’s check the last competitor to see if our theory is valid.
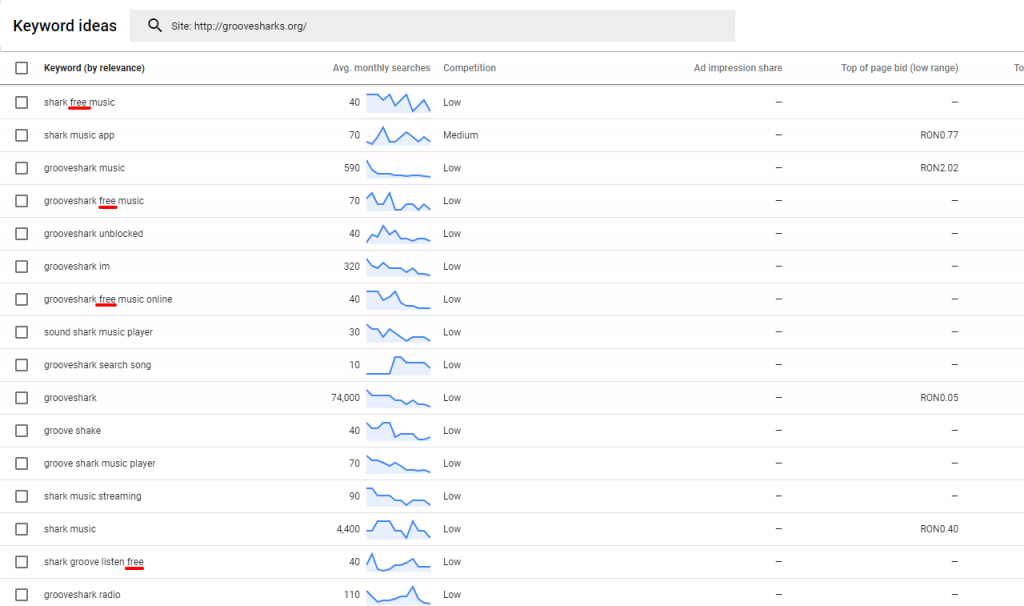
 

Keyword Planner for Grooveshark - free


Grooveshark validates our theory. For online music streaming services, people search for online music, radio and expect it to be free. We still need some more data about the users; the volume of searches per month is the next one.


We have some keywords that stand out for each competitor: “Free online streaming”, “online music” and “online Radio”. Let’s study them to find out the potential market.
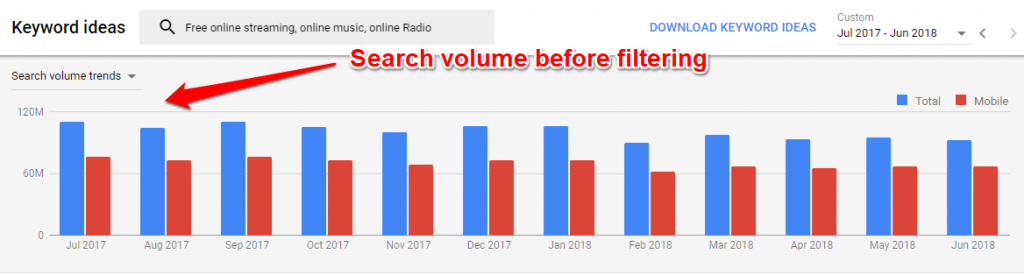
 

Volume Before Filtering


What you see in the chart above could seem too encouraging at first but these results are filled with noise (useless keywords, irrelevant for the music streaming business). Almost 60 million organic searches each month for keywords related to those we placed in the input. Let’s start filtering to get to the reliable numbers.
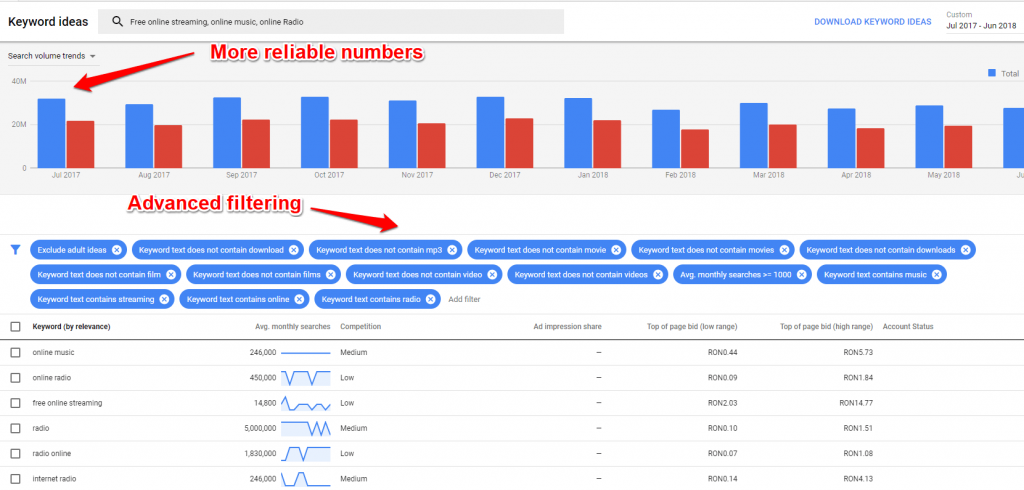
 

Advanced Filtering in Keyword Planner


After we added the filters (average monthly searches > 1000; removed other keywords), we get some real numbers about the volume of searches. The overall number of monthly searches for keywords related to online music streaming is about 200.000. This is encouraging since that could be considered potential website traffic for your new business. The numbers for the exact keywords are a bit low, free online streaming gaining 14k monthly searches, while online music 246k, online radio 450k, and radio online 1,8M searches.


So what do we know until now?

The market has about 40M monthly searches with a potential of over 120M, people are looking for online radio and online music and expect it to be free.

Also to mention is the fact that there is a slight drop in search volume during spring. Let’s see how the other tools can help us build a complete user profile and market trends.


2.2 Where Are Your Customers Looking for Your Business 


Let’s complete our users’ profile by studying the channels they are using, offered by Benchmarking in Google Analytics.
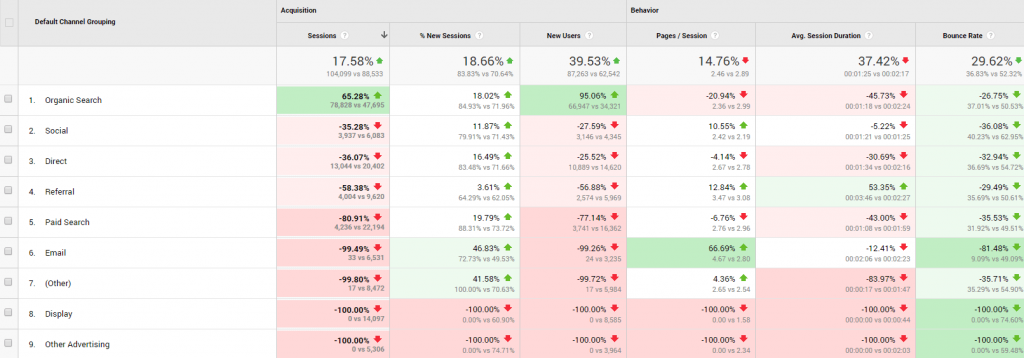
 

Bechmarking channels


I know there is a lot of data in that chart, but you should look only to the one that interests you. In our case, look at the sessions column. Using the benchmarking metrics, you can compare your data against benchmarks and make a short market research. For example, the number of organic searches had a beautiful increase of 65.28% compared to the benchmark. The site had 78,828 vs. 47,695 (the number of the organic searches for the benchmarks).


From the chart above we can see the website could improve the metrics for email, display, and other forms of advertising since the competition is there and the audience too. 


Another data you could use to see where is the audience looking for your business is the devices info. Since mobile raise so much into the statistical data, is important to offer information that can be easily accessed by mobile. 

Benchmarking devices


2.3 What Development Stage Has Your Market Reached


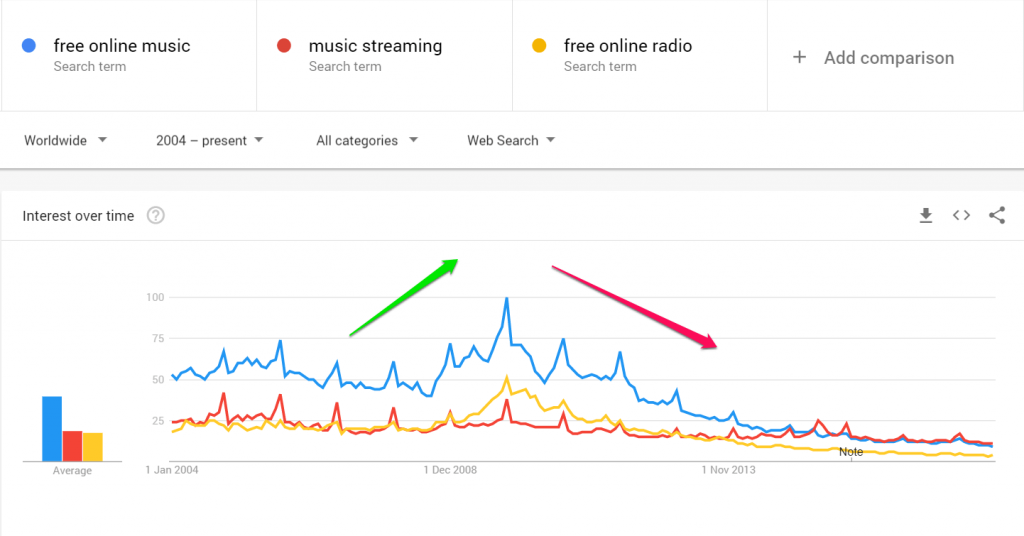
Google Trends is great at studying the stage of the market. We can insert the keywords that we believe to describe a certain market, and by studying the results we may conclude if an industry is gaining traction, if it was or is interesting to the average user. Let’s take a look below:
 

Search Interest going down


We can see that the overall trend and the search interest for “free online music”, “music streaming” and “free online radio” is in a downward trend. It peaked somewhere around 2010 and since then the interest has gone down. Now, we have to be extra careful when drawing conclusions here because there could be some errors.


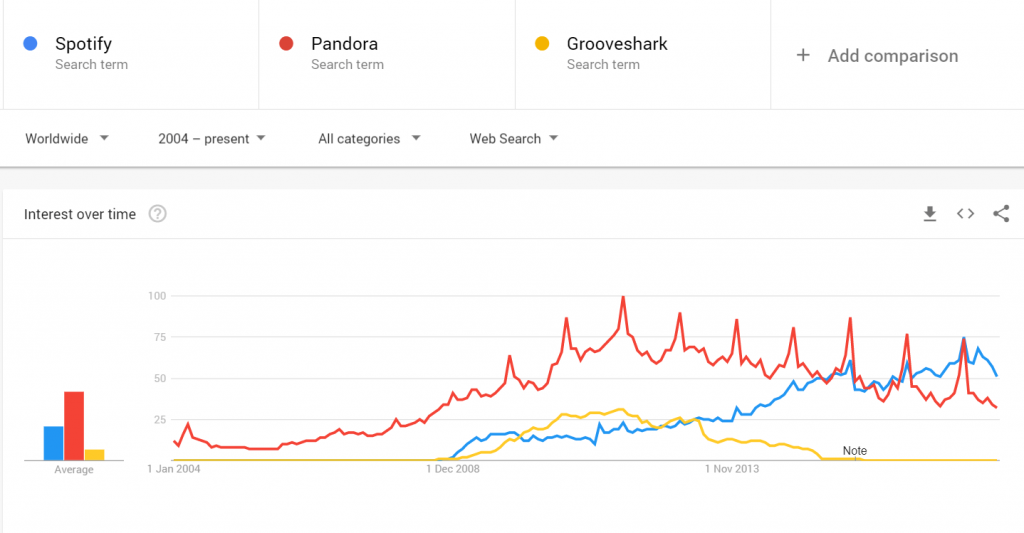
The downward trend could indicate the fact that people just aren’t interested in online music streaming, or it could just as well indicate that the market has matured and that people became loyal to a competitor. We tested this theory and searched the brands we used in our study: Spotify, Pandora, Grooveshark. 
 

Trends for spotify pandora and grooveshark


It seems like the searches for this brands started to increase around the same time when the previous terms had a drop down.


*Full disclaimer here; while we said in the beginning of the article that Google’s tools aren’t enough to make a complete marketing strategy, we feel that we should mention it again throughout the article. Do use other tools and data for a complete marketing strategy, use Google just as a starting point to get an overall image of the market.


3. Uncovering Your Competitors’ Secrets


From our last chapter we can say that we gathered a lot of data from the market. The fact that the online music streaming industry is maturing, that users have become loyal to certain brands, the personae who want free online music and spend their time on mobile devices are great assets. We can use all this Google data to make a strong marketing strategy and grow your business. Let’s now study the competitors, benchmark them and see their strengths and weaknesses.


Let’s move on with the analysis then, and the first thing to study is “Brand Power”.


3.1 Benchmark Every Metric to Your Competitor and Figure out Your Brand Power


Brand power is the interest in Google Trends over time. We inserted the brand of the three competitors we are studying into Google trends and we got the following result:


Trends for spotify pandora and grooveshark


From the analysis, we can see that Pandora has the greatest brand power among the competitors. It did have a larger lead in later years but Spotify has gained a lot of ground. Grooveshark’s brand power seems to be going down starting from 2013 and had a definitive fall in 2016. 

It’s also worth mentioning that Pandora’s trend could be affected by the launch of the movie Avatar in 2009.

The planet the movie takes place is called Pandora and Google doesn’t differentiate that in the search behavior of users. Though I don’t suspect it made large impact in the overall trend for Pandora, some spikes from the year 2009/2010 could be attributed to the movie. And right here we have our first limitation of the Google Trends tool; if your competitors have common names, we don’t really suggest using Google Trends to study their brand power.


Another reason why it has the largest trend is that another brand has exactly the same brand name: Pandora jewelry, which was founded in 1982, before the music company Pandora, that appeared in 2000.  


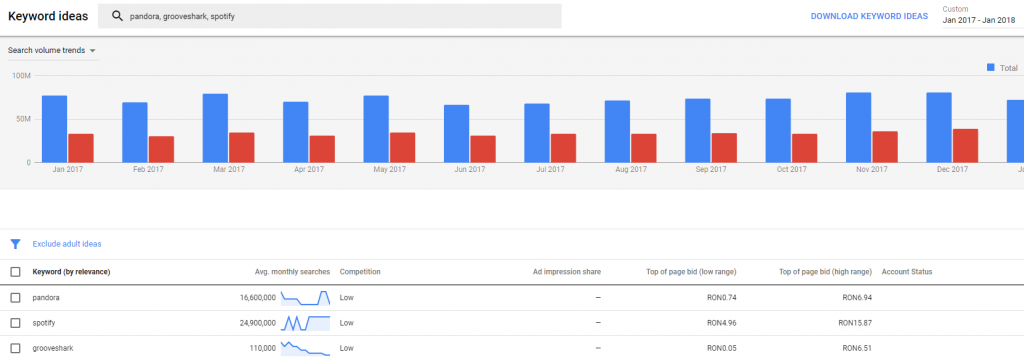
Even if the brand had a huge spike, somewhere around January – February 2017, Spotify started to outnumber Pandora. Let’s check with the Google Keywords Tool to see if the brand power is similar for January 2017 – January 2018.
 

Searches for Pandora, Spotify and Grooveshark


Indeed, the number of searches for Spotify is 60% higher than Pandora. With over 16 mil searches each month, we can note that Pandora holds the biggest market share for online music streaming.


3.2 Always Compare Yourself to Your Competitors


This is a constant process for all businesses.

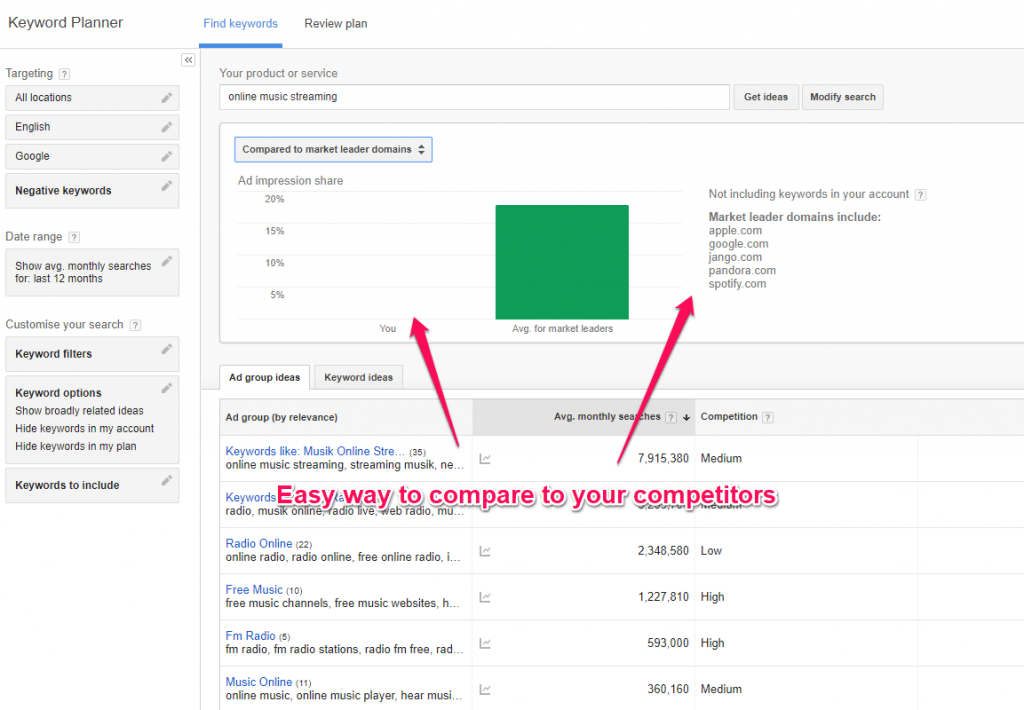
Comparing to competitors is an ongoing activity of the marketing department, or in the case of a small company, the marketing guy. What you need to keep track of here is the brand power. This is one of the most important metrics you can extract from the tools offered by Google.


It’s the way to attach a measurable number to the marketing efforts that are hard to track (content marketing). Seeing each month that the volume of searches is increasing for your brand is in a great part attributed to a great content marketing strategy, and it’s encouraging to see that people are actually searching for your brand and not only for your services.
 

Keyword Planner compare to average market


This makes things so much easier for you to study the market since you can now review the add impressions of different competitors to see exactly who is most successful.


You can even concentrate on keywords with lower competition and suggested bids where you can more easily rank in top ad positions.


3.3 Check Which Competitors Target Certain Keywords


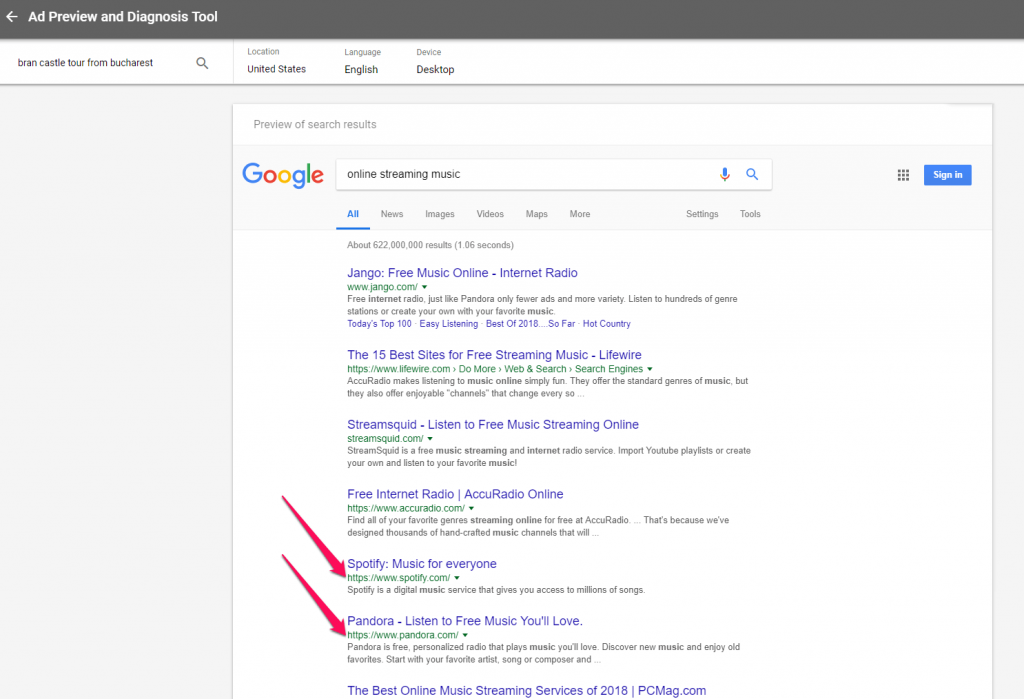
Now that we have the brand power of the competitors, let’s find a glimpse of the keywords targeted by the competitors. It’s a bit of a stretch to call it that, since the Ad Preview and Diagnosis tool shows you what keywords are targeted by the competition, not their complete search engine optimization strategy.


It’s still a great tool to figure out what each landing page is optimized for, and check your competitors’ content. You’ll have to search for the keywords you are targeting and create a list of strengths and weaknesses in terms of ranking keywords for your competitors to gain a competitive advantage. You can identify your competitors for specific keywords. Also, it offers an advantage towards your competition because you can also see the bid for certain keywords and you can use that to create better sales and marketing campaigns. 
 

Targeted Keywords by competitors


Once you’ve entered the query, Google will firstly show you the paid results and then the organic search results for the country and device you set. In case of Pandora, Google shows the place of the page in SERP which is outranked by Spotify by one position.


The next step is doing the same analysis for the other two competitors, compiling a list of all the results and trying to optimize your landing page for the same keyword groups.


4. Identify New Market Opportunities


So we went through the market, we looked at each competitor, now it’s time to figure out how to get ahead by finding new keywords that the competitors might not have yet discovered. For this, there are a couple of tricks using the Google Keyword Planner tool. We’ll try to present some ways to target keywords that will generate traction and could bring traffic to your website from various search engines.


4.1 Low Competition High Search Volume 


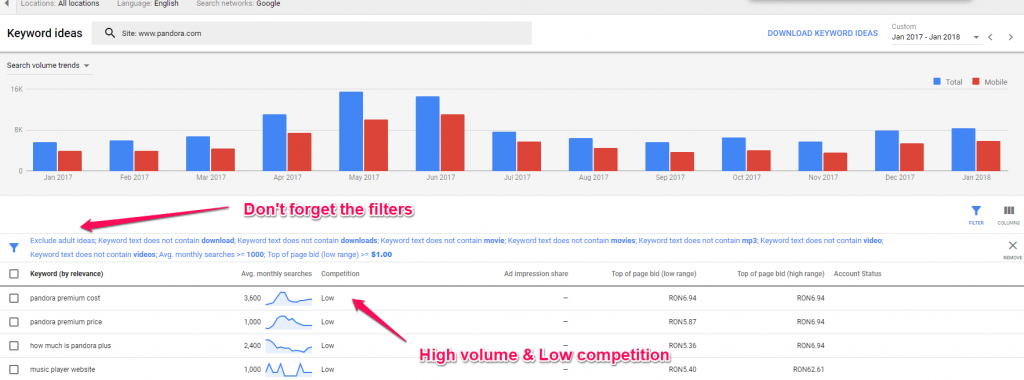
The first trick to get to those juicy keywords starts once again with entering the competitors landing page into the Google Keyword Planner. Google recognizes the website type of Pandora and begins to list out keyword ideas for it.
 

Uncovering Keywords using Google Analytics


The following filter types were added:

  • Average monthly searches > 1000
  • Suggested bid < 1.00$
  • Various negative keywords (keywords that were not relevant) to remove the noise: download, downloads, movie, video, mp3


What we’re left with are very relevant keywords for your business that have a high average monthly search and very low bids. This is exactly what you should target with your SEO strategy.


4.2 Seek for Keywords Not yet Targeted


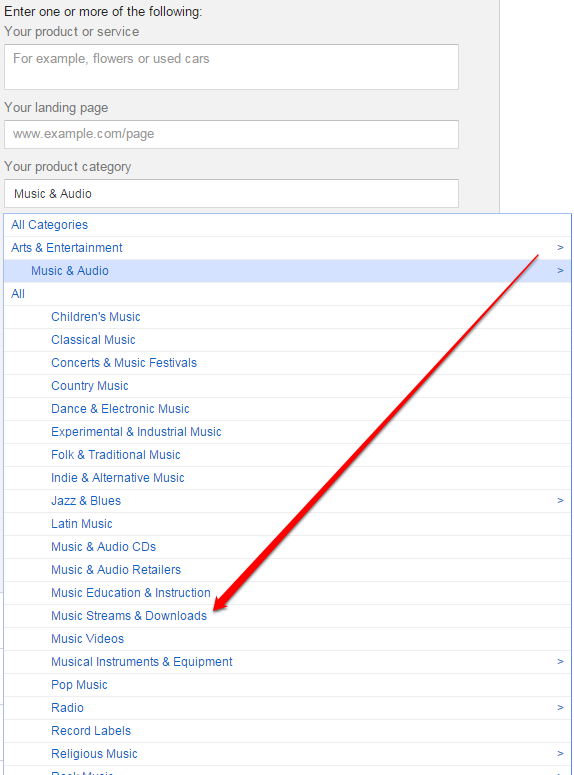
The product category search of Keyword planner is a great way to find “untapped” niches. Just select the product category that your product fits in, or you can select a category similar to yours, that you believe it holds some potential customers and begin the analysis.
 

Product Category for Keywords


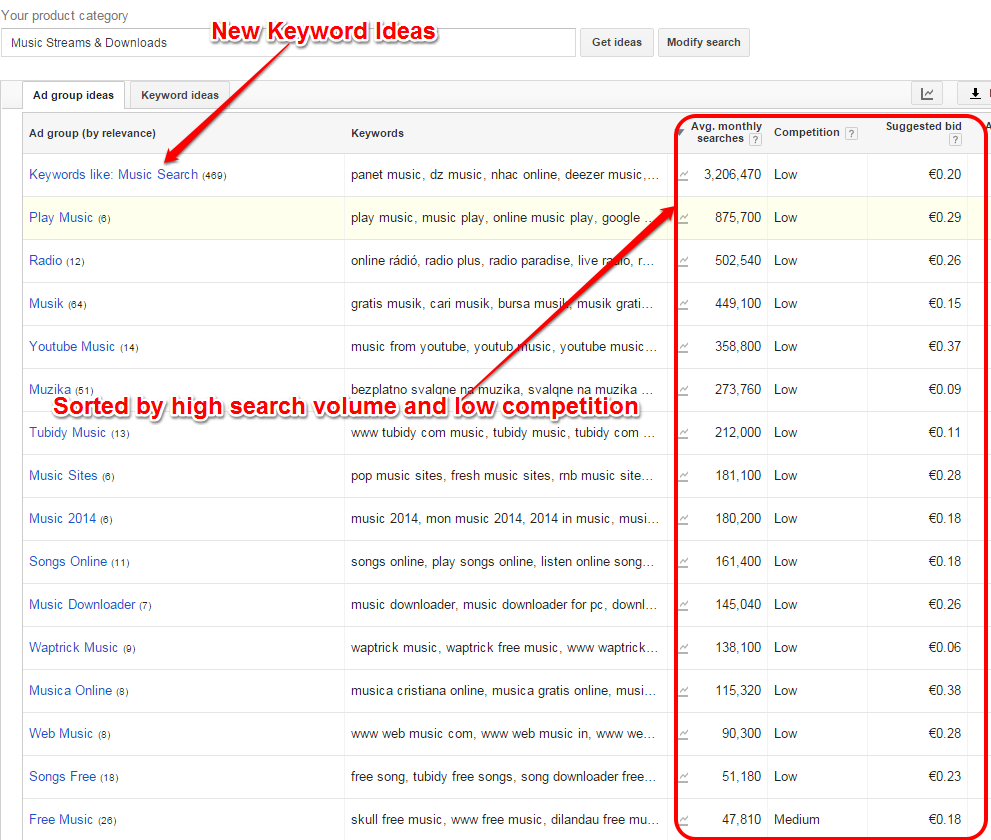
We continue with the online music streaming example and select the “Music Streams & Downloads” product category.
 

New Keywords Revealed


This is what you get.

Tons of keyword ideas that you can target with the SEO strategy, be it through content marketing or adwords.

Again, don’t take them all as Google displays it to you, filter the data. Even if it greatly reduces the potential reach and search volume why would you want to spend resources on irrelevant keywords to your business?


Always go for the high search volume keywords with low bid numbers, since your competitors aren’t really tackling them.


Conclusion


Firstly and most importantly, what we want you to gain from this post is that using only Google’s tools to make a competitor analysis is not enough. But it’s a great start, you get tons of relevant information – in such a short time – that allows you to gain a strong competitive advantage. Information that you might not find anywhere else, juicy keywords with Google Keyword Planner, industry trends and market behavior using the Google Trends Tools, constant monitoring of your competitors using Google Ads Keyword Planner and demographic, behavior and influencers data from the Google Analytics Benchmarking that can enrich your business strategy.


The second most important thing we wish you would remember from this article is the fact that the majority of the data needs to be filtered and taken in with a grain of salt. Google offers us both in the Keyword and the Display Planner tools rich filters to get to the information we really need and the one that is relevant to our industry only by enjoying all the features and benefits there are available for free.


How often do you use the Google Tools for business in your competitive analysis?


The post How to Do a Competitive Marketing Analysis Using 6 Free Google Tools appeared first on SEO Blog | cognitiveSEO Blog on SEO Tactics & Strategies.


SEO Blog | cognitiveSEO Blog on SEO Tactics & Strategies

Google’s Latest Core Algo Update Still Rolling Out

For those watching the search results to see how well (or not) sites have done with Google’s latest core algo update, you will need to watch for quite a lot longer.  Google has confirmed that the algo update is still rolling out. Danny Sullivan from Google has confirmed that the latest update is still rolling […]

The post Google’s Latest Core Algo Update Still Rolling Out appeared first on The SEM Post.


The SEM Post

Saturday, 4 August 2018

How to Do a Competitive Marketing Analysis Using 6 Free Google Tools

We’ve seen and heard many people just throwing their business online, many times with great products, and failed at it. One of the reasons they failed was a lack of a well-structured marketing plan before they started the journey and as well as of competitive intelligence data. In today’s article, we wish to address that issue by presenting the tools made available by Google and going through some concepts and ideas that can be extracted with their use.


Competitive Marketing Analysis Using Free Google Tools


Let’s talk about the free tools from Google made available for you, tools that cost nothing and can offer you enough information to gain a sense of the market you’re about to jump into, besides a handful of actions and strategies you could perform to skyrocket your business. A true jam – packed with value!


  1. Arsenal of Tools
    1. Google AdWords Keyword Planner
    2. Google Trends
    3. Google Ad Preview and Diagnosis tool
    4. Google My Business
    5. Google +
    6. Google Analytics
  2. Your Market’s Behavior
    1. Customer Behavior Unlocking
    2. Where Are Your Customers Looking for Your Business
    3. What Development Stage Has Your Market Reached
  3. Uncovering Your Competitors’ Secrets
    1. Benchmark Every Metric to Your Competitor and Figure out Your Brand Power
    2. Always Compare Yourself to Your Competition
    3. Check Which Competitors Target Certain Keywords
  4. Identify New Market Opportunities
    1. Low Competition High Search Volume 
    2. Seek for Keywords Not yet Targeted
 

1. Arsenal of Tools


First things first, the weapons you have at your disposal. We’re sure you know that Google offers a wide variety of tools, all free of charge (we’ll repeat that today), that help you gather information about the market and, more importantly, competitors information. So we have the following: Google Keyword Planner, Google Trends, Ad Preview and Diagnosis tool, Google My Business, Google + and last but not least Google Analytics.

The Free Google Tools can be used to study your current competitors and also your site or generic niche.


All the tools mentioned above can be used to benchmark your own website, but you can also use them to keep track, measure and research any other site you desire. Google doesn’t limit their use in any shape or form, so why not use them to get ahead of your market?


1.1 Google AdWords Keyword Planner


The first weapon in the arsenal is the Google AdWords Keyword Planner. Now it’s not what it used to be. We miss you “Google keyword tool”! But it does bring a lot of value to the table, in terms of performing keyword research, finding the cost and so on. You can get some pretty good suggestions. Take a look at the screenshot below.


New Keyword Planner


The tool has a free format and a paid option. All users that have an active Adwords campaign will see more accurate data, and those who use the free option will see restricted info.


If you want some juicy competitive information, consumer search behavior, then you can use this free Google tool. It shows what people are searching for, how they are searching for it, and where they are searching for it: languages, dates, volumes of searches as well as the bidding competition that’s going on in Google Adwords.


Keyword Planner marketing data


All of this by simply entering the keywords of the business you’re interested in. The next step, the pros practice, is to filter all that noise that comes with the tool, and we believe that’s what most people are complaining about this tool, the noise. What’s left after the advanced filtering action are the keywords that you want for your business. Especially the keywords with a high search volume, low competition with really low bidding war going on. We’ll get into that later on, let’s move on to the next weapon.


1.2 Google Trends


Another great tool for marketers to make competitive research is Google Trends. This one is by far our favorite tool when studying markets. It basically shows the search interest of people for certain keywords. What you should use it for is to study the market you want to tackle.


 Digital vs online marketing


And the search interest over time is not the only thing that Google Trends provides. It’s also a great way to study the market from different regions. In the example we’ve taken, we compared the search interest for digital vs. online marketing. Below you can see which countries search for the words “digital marketing” and which one search for “online marketing”. Now if you look at the screenshots below what can you notice?


Regional interest Google trends


The “digital marketing” search phrase ranks really well in countries such as France and Morroco. The users have different search behaviors, that’s what we want to show with this. Mexico, Columbia and Peru look more colored in this screenshot than the one for “online marketing”. Canada and US are also more keen to use “digital marketing”. 


On the other side, the “online marketing” has more searches in Germany, Netherlands, Austria, Romania and Vietnam. 


Regional interest Google trends for online marketing


This type of small researches can help you take some decisions before considering a digital marketing strategy to promote your business. 


Google Trends even offers some of the Google Keyword Planner tool functions by suggesting related keywords for the one you’ve just entered. You can use it to keep track of the keywords that are gaining ground rapidly (rising) and from those, you can notice some opportunities for your competitive strategy.


Related queries to digital marketingRelated queries to online marketing


You can even see the relates queries for sub-regions or a specific country, by clicking on the state you want. You even see the data for each city.


Interest by sub-region


1.3 Google Ad Preview and Diagnosis Tool


Ad Preview and Diagnosis tool is a great addition to enrich your competitor analysis. In theory, this tool provides you with the position of your competitor’s ad (along with yours, if that’s the case). You can see your top competitors and what keywords (or phrases) they are tracking, what they are promoting. You’ll get a closer step in understanding your competition. 


Ad Preview and Diagnosis Tool


1.4 Google My Business


Google My Business can really push your business on SERP if you setup your account correctly and let your customers know they can leave reviews. The tool is entirely free and it is easy to use.  When creating a page, it is recommended to see if the business isn’t already on Maps. If you found it, you have to claim it and edit the info, following the steps from the screenshot below.


claim your local business


In case you don’t find it, you’ll have to create it. Add your business address, type of business, and website. After that, you’ll have to wait for a confirmation (a verification code in a postcard, most probably) which comes through mail, and that can take up to 14 days. Select businesses have the option to verify the business listing by phone or email.


To level up, add high-quality pictures regarding your office and business; add street-view, get reviews for your website, because they will help you rank higher in Map searches. Connect it with the Google + profile to get even more exposure. 


After you finished setting up your Google My Business page, you can edit and perform other changes or see performance metrics directly from the Dashboard:


Google My Business Dashboard


1.5 Google +


Another tool in Google’s arsenal is Google +. I think social media was born to spy and follow what other people are doing without them knowing. It’s acting like the Invisibility Cloak. Google + is a powerful tool because it offers you the possibility to see what your competitor is sharing, if it has an active account, if it is has a verified account, the circles it’s in, the marketing campaigns it runs and many more. 


In the example below, you can see Lenovo’s Google + profile. It has a complete profile, integrated with other Google tool such as Hangouts, Google Calendar, Gmail plus links to its other social channels such as blog, Facebook, Instagram. 


Google plus profile


At a quick scroll on their page, you’ll see posts mostly with inspirational messages and quotes, along with technology pictures mixing with pictures regarding the team and other Lenovo activities, and some Star Wars references. Doing a short analysis of their page help you see which type of content had more traction, get inspiration for your posts to attract the audience and get an overview of your competitor’s online presence.


We’ve witnessed a social signals impact that gets higher and higher as the time passes by. Social Media influences the evolution of a business. We made an in-house research where we analyzed the influence of social signals towards a website’s rankings. It showed that a strong presence on social networks is correlated with better rankings.


1.6. Google Analytics


To complete your market research use Google Analytics. There are some things from Google analytics that can give you an idea of your competition and your industry. The benchmarking option allows you to compare your data with aggregated industry data from other companies who share their data. That means you can get an idea of what happens with those that are in your niche – your competitors. You have to enable benchmarking first: 


Enable benchmarking


After that, you’ll be able to see data related to devices, location and channels, which can give you a slight idea to see where you should focus more, where your competition is, where you have issues. More than that, you’ll have the opportunity to get some insights on your market segment.


Benchmarking data


2. Your Market’s Behavior


Now that you’re familiar with the tools and what we are going to use them for, let’s take a real market example and see how we use it. We chose to take the music streaming market to explain an in-depth use of Google’s arsenal. The first thing when trying to enter a market is trying to learn the behavior of the consumers. When researching, we are going to focus on the following:

  • What do consumers search for?
  • What are the consumers’ expectations?
  • How are the competitors taking advantage of the consumers’ search behavior?
  • Which are the overall market trends?
  • What is the brand power of my competitors?
  • Can we find any hidden opportunities?
 

2.1  Customer Behavior Unlocking


The first tool we go to in our analysis of the music streaming market is the Google Keyword Planner. This tool will answer the first two questions (What are consumers searching for? & What are their expectations?) and maybe give us a hint for the last question (Hidden opportunities). To get to the answers, we inserted the landing pages of our future competitors in the keyword planner and began to read what it provides.


The competitors we considered for our analysis are Spotify, Pandora and Grooveshark. There are plenty more to study in order to make a complete analysis, but for the purpose of presenting how to do a competitive analysis information, we consider this to be sufficient to start with.


Search for your competitor’s website, add filters and removed the noise. All that is left are relevant keywords that the users search for to get to the pages.


Keyword Planner for Spotify - card and trial


By entering the landing page for Spotify, Google Keywords Tools will show some keywords recommendations that might be related and could fit its description.

If we look at the keywords suggested by Google, an overwhelming amount contain the word “gift card” and “30 days trial”.

We can already start to figure out some expectations for the future users of our tool. Potential users don’t want to pay for it, they expect it to be free. Let’s study the other two competitors to see if this behavior fits all the users.


 Keyword Planner for Pandora - free and upgrade


For Pandora, the situation is almost the same. The difference here is that Google also suggests the word “upgrade” and “radio” more often. Their SEO efforts could have focused on promoting the service as an online radio in order to gather more website visitors from Google who search for this kind of service.

We can already start painting the persona for the user who searches for online music streaming.


Let’s check the last competitor to see if our theory is valid.


Keyword Planner for Grooveshark - free


Grooveshark validates our theory. For online music streaming services, people search for online music, radio and expect it to be free. We still need some more data about the users; the volume of searches per month is the next one.


We have some keywords that stand out for each competitor: “Free online streaming”, “online music” and “online Radio”. Let’s study them to find out the potential market.


Volume Before Filtering


What you see in the chart above could seem too encouraging at first but these results are filled with noise (useless keywords, irrelevant for the music streaming business). Almost 60 million organic searches each month for keywords related to those we placed in the input. Let’s start filtering to get to the reliable numbers.


Advanced Filtering in Keyword Planner


After we added the filters (average monthly searches > 1000; removed other keywords), we get some real numbers about the volume of searches. The overall number of monthly searches for keywords related to online music streaming is about 200.000. This is encouraging since that could be considered potential website traffic for your new business. The numbers for the exact keywords are a bit low, free online streaming gaining 14k monthly searches, while online music 246k, online radio 450k, and radio online 1,8M searches.


So what do we know until now?

The market has about 40M monthly searches with a potential of over 120M, people are looking for online radio and online music and expect it to be free.

Also to mention is the fact that there is a slight drop in search volume during spring. Let’s see how the other tools can help us build a complete user profile and market trends.


2.2 Where Are Your Customers Looking for Your Business 


Let’s complete our users’ profile by studying the channels they are using, offered by Benchmarking in Google Analytics.


Bechmarking channels


I know there is a lot of data in that chart, but you should look only to the one that interests you. In our case, look at the sessions column. Using the benchmarking metrics, you can compare your data against benchmarks and make a short market research. For example, the number of organic searches had a beautiful increase of 65.28% compared to the benchmark. The site had 78,828 vs. 47,695 (the number of the organic searches for the benchmarks).


From the chart above we can see the website could improve the metrics for email, display, and other forms of advertising since the competition is there and the audience too. 


Another data you could use to see where is the audience looking for your business is the devices info. Since mobile raise so much into the statistical data, is important to offer information that can be easily accessed by mobile. 

Benchmarking devices


2.3 What Development Stage Has Your Market Reached


Google Trends is great at studying the stage of the market. We can insert the keywords that we believe to describe a certain market, and by studying the results we may conclude if an industry is gaining traction, if it was or is interesting to the average user. Let’s take a look below:


Search Interest going down


We can see that the overall trend and the search interest for “free online music”, “music streaming” and “free online radio” is in a downward trend. It peaked somewhere around 2010 and since then the interest has gone down. Now, we have to be extra careful when drawing conclusions here because there could be some errors.


The downward trend could indicate the fact that people just aren’t interested in online music streaming, or it could just as well indicate that the market has matured and that people became loyal to a competitor. We tested this theory and searched the brands we used in our study: Spotify, Pandora, Grooveshark. 


Trends for spotify pandora and grooveshark


It seems like the searches for this brands started to increase around the same time when the previous terms had a drop down.


*Full disclaimer here; while we said in the beginning of the article that Google’s tools aren’t enough to make a complete marketing strategy, we feel that we should mention it again throughout the article. Do use other tools and data for a complete marketing strategy, use Google just as a starting point to get an overall image of the market.


3. Uncovering Your Competitors’ Secrets


From our last chapter we can say that we gathered a lot of data from the market. The fact that the online music streaming industry is maturing, that users have become loyal to certain brands, the personae who want free online music and spend their time on mobile devices are great assets. We can use all this Google data to make a strong marketing strategy and grow your business. Let’s now study the competitors, benchmark them and see their strengths and weaknesses.


Let’s move on with the analysis then, and the first thing to study is “Brand Power”.


3.1 Benchmark Every Metric to Your Competitor and Figure out Your Brand Power


Brand power is the interest in Google Trends over time. We inserted the brand of the three competitors we are studying into Google trends and we got the following result:


Trends for spotify pandora and grooveshark


From the analysis, we can see that Pandora has the greatest brand power among the competitors. It did have a larger lead in later years but Spotify has gained a lot of ground. Grooveshark’s brand power seems to be going down starting from 2013 and had a definitive fall in 2016. 

It’s also worth mentioning that Pandora’s trend could be affected by the launch of the movie Avatar in 2009.

The planet the movie takes place is called Pandora and Google doesn’t differentiate that in the search behavior of users. Though I don’t suspect it made large impact in the overall trend for Pandora, some spikes from the year 2009/2010 could be attributed to the movie. And right here we have our first limitation of the Google Trends tool; if your competitors have common names, we don’t really suggest using Google Trends to study their brand power.


Another reason why it has the largest trend is that another brand has exactly the same brand name: Pandora jewelry, which was founded in 1982, before the music company Pandora, that appeared in 2000.  


Even if the brand had a huge spike, somewhere around January – February 2017, Spotify started to outnumber Pandora. Let’s check with the Google Keywords Tool to see if the brand power is similar for January 2017 – January 2018.


Searches for Pandora, Spotify and Grooveshark


Indeed, the number of searches for Spotify is 60% higher than Pandora. With over 16 mil searches each month, we can note that Pandora holds the biggest market share for online music streaming.


3.2 Always Compare Yourself to Your Competitors


This is a constant process for all businesses.

Comparing to competitors is an ongoing activity of the marketing department, or in the case of a small company, the marketing guy. What you need to keep track of here is the brand power. This is one of the most important metrics you can extract from the tools offered by Google.


It’s the way to attach a measurable number to the marketing efforts that are hard to track (content marketing). Seeing each month that the volume of searches is increasing for your brand is in a great part attributed to a great content marketing strategy, and it’s encouraging to see that people are actually searching for your brand and not only for your services.


Keyword Planner compare to average market


This makes things so much easier for you to study the market since you can now review the add impressions of different competitors to see exactly who is most successful.


You can even concentrate on keywords with lower competition and suggested bids where you can more easily rank in top ad positions.


3.3 Check Which Competitors Target Certain Keywords


Now that we have the brand power of the competitors, let’s find a glimpse of the keywords targeted by the competitors. It’s a bit of a stretch to call it that, since the Ad Preview and Diagnosis tool shows you what keywords are targeted by the competition, not their complete search engine optimization strategy.


It’s still a great tool to figure out what each landing page is optimized for, and check your competitors’ content. You’ll have to search for the keywords you are targeting and create a list of strengths and weaknesses in terms of ranking keywords for your competitors to gain a competitive advantage. You can identify your competitors for specific keywords. Also, it offers an advantage towards your competition because you can also see the bid for certain keywords and you can use that to create better sales and marketing campaigns. 


Targeted Keywords by competitors


Once you’ve entered the query, Google will firstly show you the paid results and then the organic search results for the country and device you set. In case of Pandora, Google shows the place of the page in SERP which is outranked by Spotify by one position.


The next step is doing the same analysis for the other two competitors, compiling a list of all the results and trying to optimize your landing page for the same keyword groups.


4. Identify New Market Opportunities


So we went through the market, we looked at each competitor, now it’s time to figure out how to get ahead by finding new keywords that the competitors might not have yet discovered. For this, there are a couple of tricks using the Google Keyword Planner tool. We’ll try to present some ways to target keywords that will generate traction and could bring traffic to your website from various search engines.


4.1 Low Competition High Search Volume 


The first trick to get to those juicy keywords starts once again with entering the competitors landing page into the Google Keyword Planner. Google recognizes the website type of Pandora and begins to list out keyword ideas for it.


Uncovering Keywords using Google Analytics


The following filter types were added:

  • Average monthly searches > 1000
  • Suggested bid < 1.00$
  • Various negative keywords (keywords that were not relevant) to remove the noise: download, downloads, movie, video, mp3


What we’re left with are very relevant keywords for your business that have a high average monthly search and very low bids. This is exactly what you should target with your SEO strategy.


4.2 Seek for Keywords Not yet Targeted


The product category search of Keyword planner is a great way to find “untapped” niches. Just select the product category that your product fits in, or you can select a category similar to yours, that you believe it holds some potential customers and begin the analysis.


Product Category for Keywords


We continue with the online music streaming example and select the “Music Streams & Downloads” product category.


New Keywords Revealed


This is what you get.

Tons of keyword ideas that you can target with the SEO strategy, be it through content marketing or adwords.

Again, don’t take them all as Google displays it to you, filter the data. Even if it greatly reduces the potential reach and search volume why would you want to spend resources on irrelevant keywords to your business?


Always go for the high search volume keywords with low bid numbers, since your competitors aren’t really tackling them.


Conclusion


Firstly and most importantly, what we want you to gain from this post is that using only Google’s tools to make a competitor analysis is not enough. But it’s a great start, you get tons of relevant information – in such a short time – that allows you to gain a strong competitive advantage. Information that you might not find anywhere else, juicy keywords with Google Keyword Planner, industry trends and market behavior using the Google Trends Tools, constant monitoring of your competitors using Google Ads Keyword Planner and demographic, behavior and influencers data from the Google Analytics Benchmarking that can enrich your business strategy.


The second most important thing we wish you would remember from this article is the fact that the majority of the data needs to be filtered and taken in with a grain of salt. Google offers us both in the Keyword and the Display Planner tools rich filters to get to the information we really need and the one that is relevant to our industry only by enjoying all the features and benefits there are available for free.


How often do you use the Google Tools for business in your competitive analysis?


The post How to Do a Competitive Marketing Analysis Using 6 Free Google Tools appeared first on SEO Blog | cognitiveSEO Blog on SEO Tactics & Strategies.


SEO Blog | cognitiveSEO Blog on SEO Tactics & Strategies

Calculated Fields in Google Data Studio - Whiteboard Friday

Posted by DiTomaso

Google Data Studio is a powerful tool to have in your SEO kit. Knowing how to get the most out of its power begins with understanding how to use calculated fields to apply good old-fashioned math to your data. In this week"s Whiteboard Friday, we"re delighted to welcome guest host Dana DiTomaso as she takes us through how to use calculated fields in Google Data Studio to uncover more value in your data and improve your reports.

Calculated Fields in Google Data Studio

Click on the whiteboard image above to open a high-resolution version in a new tab!

Video Transcription

Hi, Moz fans. I"m Dana DiTomaso, President and partner at Kick Point, and we love Google Data Studio at Kick Point. You may not love Google Data Studio yet, but after you watch this I think you probably will.

One of the first things that you think about Google Data Studio is: Why would I use this? It"s just charts. It"s the same thing I can get in Analytics or a billion other dashboarding tools out there. But one of the things that I really like about Google Data Studio is math. You can do lots of different stuff in Data Studio, and I"m going to go through four of the basic types in Data Studio and then how you can use that to improve your reports, just as you sort of dip your toes into the Google Data Studio pool. What I"ve done here is I have written out a lot of the formulas that you"re going to be using.

The types

It"s a lot of obviously written out formulas, but when you get into Data Studio, you should be able to type these in and they"ll work. Let"s start at the beginning with the types.

  1. Basic math. This is pretty obvious. 1 + 1 = 2. Phone calls plus emails equals this, for example. You can add together different fields.
  2. Transforms. Let"s say people are really bad at writing some things upper case and some things lower case. You have a problem with URLs being written a couple of different ways. You can use a transform to transform upper case into lower case. That"s pretty nice.
  3. Formulas. Formulas is where you"re saying only show this subset of the data. Or how often does this happen? That could be things like the Count function, so count how many times this occurs, for example, and present that as a totally separate metric, which can be really useful for things like when you want to count the number of times an event occurs and then compare that against something else. It can just pull out that kind of data.
  4. Logic. This is the more complex one. If X, then Y. If this happens, then that"s going to happen. There"s a lot of really complex stuff in there. But if you"re just getting started, start with this, and then look at the Google Data Studio documentation. You"ll find some cooler stuff in there.

1. Basic math

Here are some examples of how we use this in our Google Data Studio dashboards. So basic math, one of the things that a lot of people care about is: Are people getting in touch with me?

This is the basics of the reason why we do marketing. Are people getting in touch? So, for example, you can do some basic math and say, "All right. So I know on our website in Google Tag Manager, we have a trigger that fires whenever somebody taps or clicks a MailTo link on the site." In addition to that, we"re tracking how many people submit a form, as you should.

Instead of reporting these separately, really they"re kind of the same thing. They"re emailing one way or the other. Why don"t we just submit them as one metric? So in that case, you can say grab all the mail to form completions and then grab all the form goal completions, and now you have a total email requests or total requests or whatever you might want to call it. You can do the same thing where it"s like, well, phone calls and emails, does it really matter if they"re in separate buckets?

Just put them all in one. The same thing with the basic math. Just add it all together and then you"ve got one total metric you can present to the client. Here"s how much money we made for you. Boom. That"s a nice one. The next thing — I"m just going to flip over here — is formulas.

2. Formulas

Okay, so formulas, one of the things that I really like doing is looking at your Google Search Console data. This is in Data Studio. You"re going to use Search Console for this, which is a nice data source. We all know Search Console data is not necessarily 100% accurate, but there"s always lots of keyword treasure in there to be found if it"s easy to find, which the Search Console interface isn"t super great.

So you can make a report in Data Studio and say regex match, and so don"t be afraid of regex. I think everyone should learn it. But if you"re not super familiar with it, this is a really easy way to do it. Say, okay, every time a keyword contains why, how, can, what, for example, then those are question searches. You may change it to whatever makes sense for you.

But this is just pulling out that subset of data. Then you can see, so if these are question searches, do we have content that answers that question? No. Maybe this is something we need to think about. Or we"re getting impressions for this. You could filter it and say only show questions searches where our average rank is below 20. Maybe if we improve this content, this is a featured snippet opportunity for us, for example. That"s a real gold mine of data you can play around with.

3. Transforms

The third one is transforms. As I mentioned earlier, this is a really nice way to take Facebook, for example. We had a client who had Facebook in all upper case and Facebook in title case and Facebook in lower case in their sources and mediums, because they were very casual with how they used their UTM codes. We just standardized them all to go to lower, and those are nice text transforms that you can do.

It just makes things look a little bit nicer. I do recommend doing some of this, especially if you have messy data.

4. Logic

Then the big one here. This is logic, and I"m just going to toss over here for a second. Now logic has a lot of different components. What I"m showing you right now is a case when else end transform or logic. We use this to tidy up bad channel data.

So that client that I mentioned, who was just super casual with their UTM tags and they would just put in any old stuff, I think they had retargeting ads as a medium. You can set up channels and whatnot in Google Analytics. But I mean, really, when it comes down to it, not everybody is great at following the rules for UTMs that you"ve set up. Stuff happens.

It"s okay. You can fix it in Data Studio. Especially if you open up Google Analytics and you see that you have this other channel, which I"m sure when we"ve inherited an Analytics account, we take a look at it, and there"s this channel, and it"s just a big bag of crap.

You can go in there and turn that into real, useful, actual channel data that matches up with where it should go. What I"ve got here is a really simple example. This could go on for lines and line and lines. I"ve just included two lines because this whiteboard is only so big.

So you start off by saying case. It is the case when, is the idea when, and then the first line here is source equals direct and medium equals not set or medium none, then direct. So I"m saying, okay, so this is the basics of how direct traffic happens.

If the source is direct and the medium is not set or the medium is none, like if I have no data whatsoever, now it"s direct traffic. Great, that"s basically what Google Analytics does. Nothing fancy is going on here. Now here"s the next thing. In this case, I"m saying now I"m combining a regex match, which we talked about up here, with the case, and so now what I"m saying is when regex match medium, and then I"ve got this here.

Don"t be scared of this. I know it"s regex and maybe you"re not super comfortable with it, but this is pretty elementary stuff, and once you do this, you will feel like a data wizard, I guarantee. The first time I did this I stood up from my computer and said "Yes" the first time it worked. Just play with it. It"s going to be awesome. So you"ve got a little ... what"s the thing called? You"ve got a little up arrow thingy there, very bad mediums dollar sign.

What this is saying is that if you"ve got anything in there that"s sort of a weird medium, just write out all the crud that people have put in there over the years, all the weird mediums that totally don"t make any sense at all. Just put it all in there and then you can toss it in a bucket say called paid social. You can do the same thing with referral traffic. Or, for example, this is really useful if a client is saying, "Well, I want to know how this set of affiliate traffic compares to say this set of affiliate traffic," then you can separate these out into different buckets.

This isn"t just for channel data. I"ve done this, for example, where we were looking at social data and we were comparing NFL teams as an example for another tool, Rival IQ. What I said was, okay, so these teams here are in the AFC East, and these teams are in the AFC West. If I"ve screwed up and I said AFC East and West, please don"t get mad at me in the comments. I promise I play fantasy football. I just don"t remember right now.

But you can combine different areas. This is great for things like sales regions, for example. So North America equals Canada plus the USA plus Mexico, if you"re feeling generous. This is NAFTA politics. It really depends on what you want to do with those sales regions and how your data, what is meaningful for you. That"s the most important thing about this is that you can change this data to be whatever you need it to be to make that reporting so much easier for you.

I mean, Else then, we don"t know if this might actually output. I haven"t tried this myself. If it does, please leave a comment and let me know.

Then you end up with an End. When you"re in Data Studio, when you"re making these calculated formulas, you"ll see right away whether or not it works or not. Just keep trying until you see it happen.

One of the great things about Data Studio is that if it"s right, you"ll see these types of colors, and I"ve used different color whiteboard markers to indicate how it should look. If you see red where you should be seeing black or green where you should be seeing black, for example, then you know you"ve typed in something wrong in your formula. For me, typically I find it"s a misplaced bracket. Just keep an eye on that.

Have fun with Data Studio. One of the great things too is that you can"t mess up your original data when doing calculated fields, so you can go hog wild and it"s not going to mess with the original data. I hope you have a great time in Data Studio. Tell me what you"ve done in the comments, please. Thank you.

Video transcription by Speechpad.com


Sign up for The Moz Top 10, a semimonthly mailer updating you on the top ten hottest pieces of SEO news, tips, and rad links uncovered by the Moz team. Think of it as your exclusive digest of stuff you don"t have time to hunt down but want to read!

The Moz Blog